Data is scattered
Machines, ERP and spreadsheets each show part of the picture. Your team has to assemble the full view manually.
Ignition connects your machines and business systems. K2 turns their data into clear dashboards, automatic alerts and digital workflows, helping you see where production can improve.



Ignition is the data hub for your production. It brings data from machines, databases and business software together, turning it into useful views, alerts and digital workflows.
Your data no longer stays isolated in separate systems. You can see the connections and build on the equipment and software you already use.
As a Gold-certified integrator, K2 builds your application from the first connection to daily operation, with experience in production, quality and industrial IT.
The platform from Inductive Automation grows with your needs. We clarify feasibility and budget for your first application, then extend it to further lines and sites.



Machines, ERP and spreadsheets each show part of the picture. Your team has to assemble the full view manually.
The line is running again, but the event history is missing. Recurring causes are difficult to identify.
Reports are compiled after the shift. Deviations appear when the opportunity to act has already passed.
Work instructions, open actions and responsibilities are spread across several systems.
Open interfaces connect equipment from different manufacturers with databases and business systems. Your team works with a shared, traceable data set.
Views, alarms, trends and reporting share one platform. Suitable modules and custom workflows turn information into action.
Start with one use case. Add machines, sites and features step by step, building on the same platform.
These K2 application examples show how scattered data becomes a useful solution. We tailor the screens, data connections and workflows to your operation.
Enlarge image ↗
Bring together OEE, quality, delivery performance and maintenance data from equipment, ERP, planning and quality systems.
Identify priorities for the daily production meeting.
 Enlarge image ↗
Compare actuals with targets, follow trends and inspect the underlying records.
Understand deviations and follow up with the right questions.
 Enlarge image ↗
Review consumption trends and the shares of individual areas to spot changes that need attention.
Focus investigation on energy-intensive areas.
 Enlarge image ↗
A Sankey diagram traces power from the incoming supply through transformers to individual consumers.
Understand relationships in the supply network at a glance.
 Enlarge image ↗
Link documents from the document management system to production steps and display them at the workstation.
Reduce searching and make the right instructions available.
 Enlarge image ↗
Bring together actions from quality, maintenance and ERP with owners, due dates and progress.
Keep open items visible and follow up on commitments.
Illustrations are based on existing applications, with neutral labels and sample data. We tailor the features and KPIs to your processes.
We also build plant visualisation, alarms, histories and shift reports with Ignition. We can train your team to extend the application themselves.
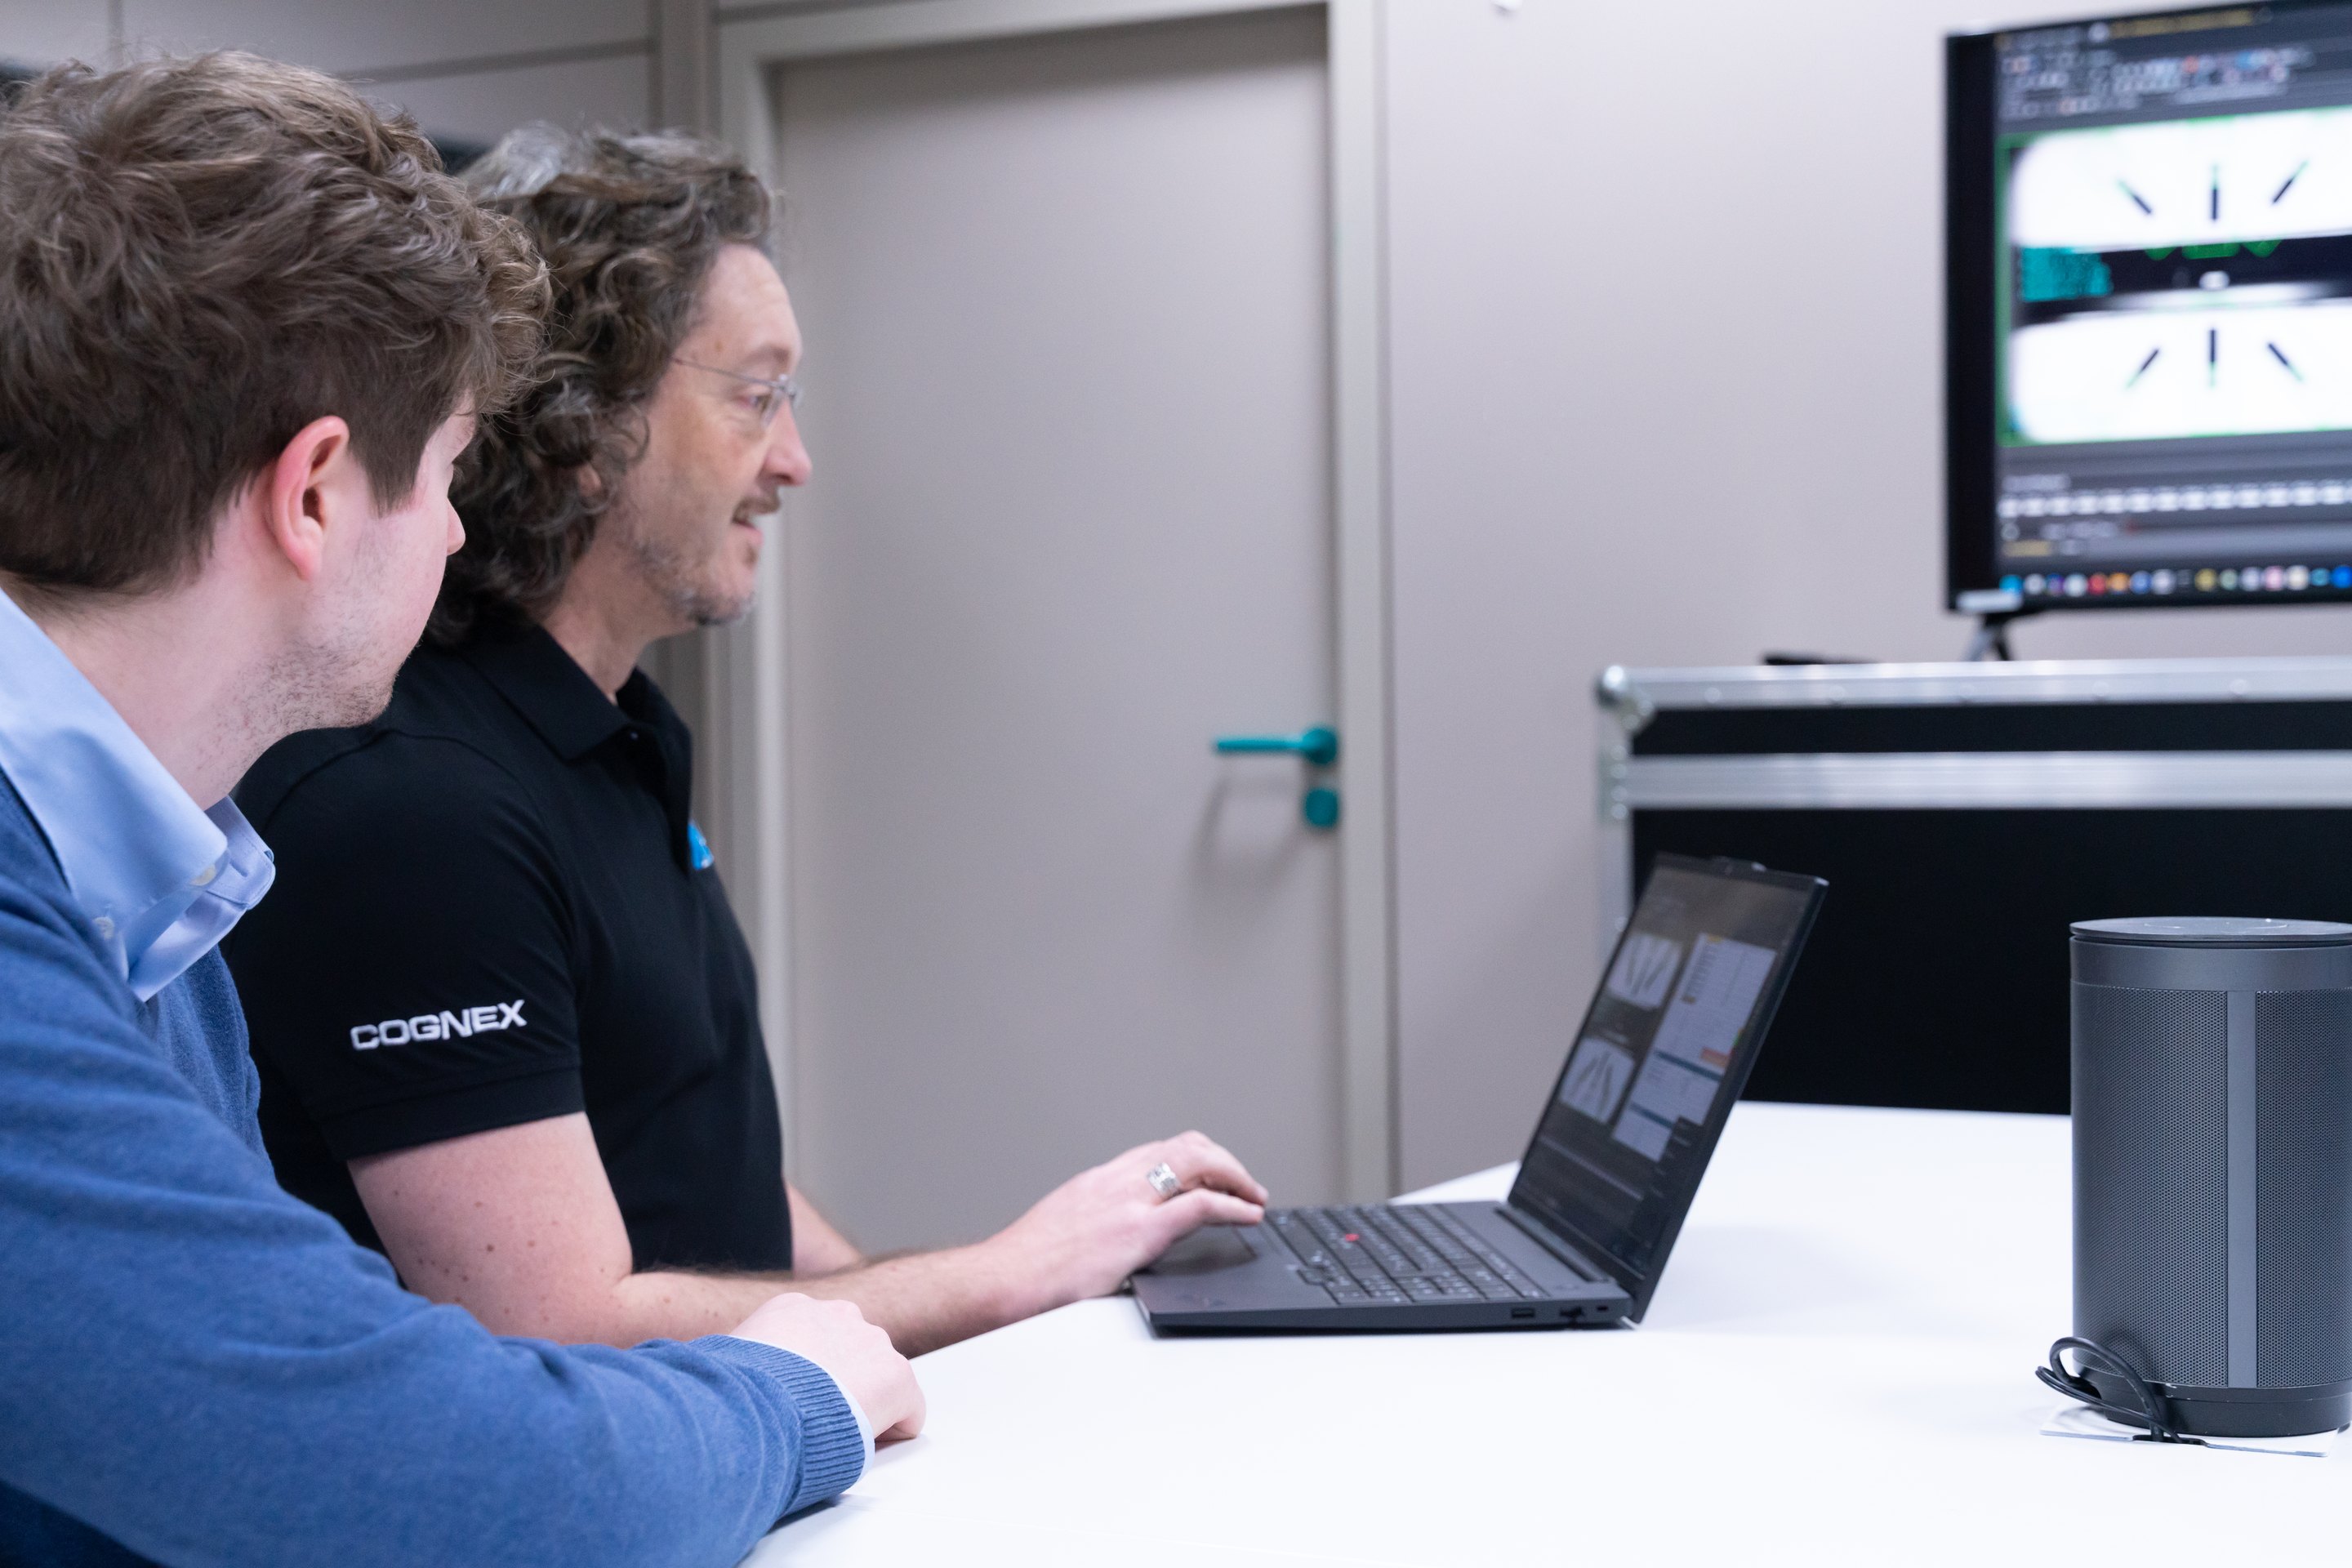
With K2-DataFlow, we establish value and feasibility before you invest in implementation.
We work with your users to identify the decision or workflow to improve and the data available.
A focused test checks the data connection, screens and analysis so the benefits and technical limits become clear early.
You receive a clear proposal covering scope, modules, effort and budget before deciding on implementation.
We commission the solution with your team and use operational feedback to develop it further, including additional lines and sites.
Show us where information is missing or workflows take too long. Together we identify a suitable starting point.
We show you applications and discuss the data sources and features that matter to your operation.
You receive an initial assessment of feasibility and next steps. Detailed implementation is quoted separately.

Integrator

Integrator

Developer

CEO & Co-Founder

Integrator

CEO & Co-Founder
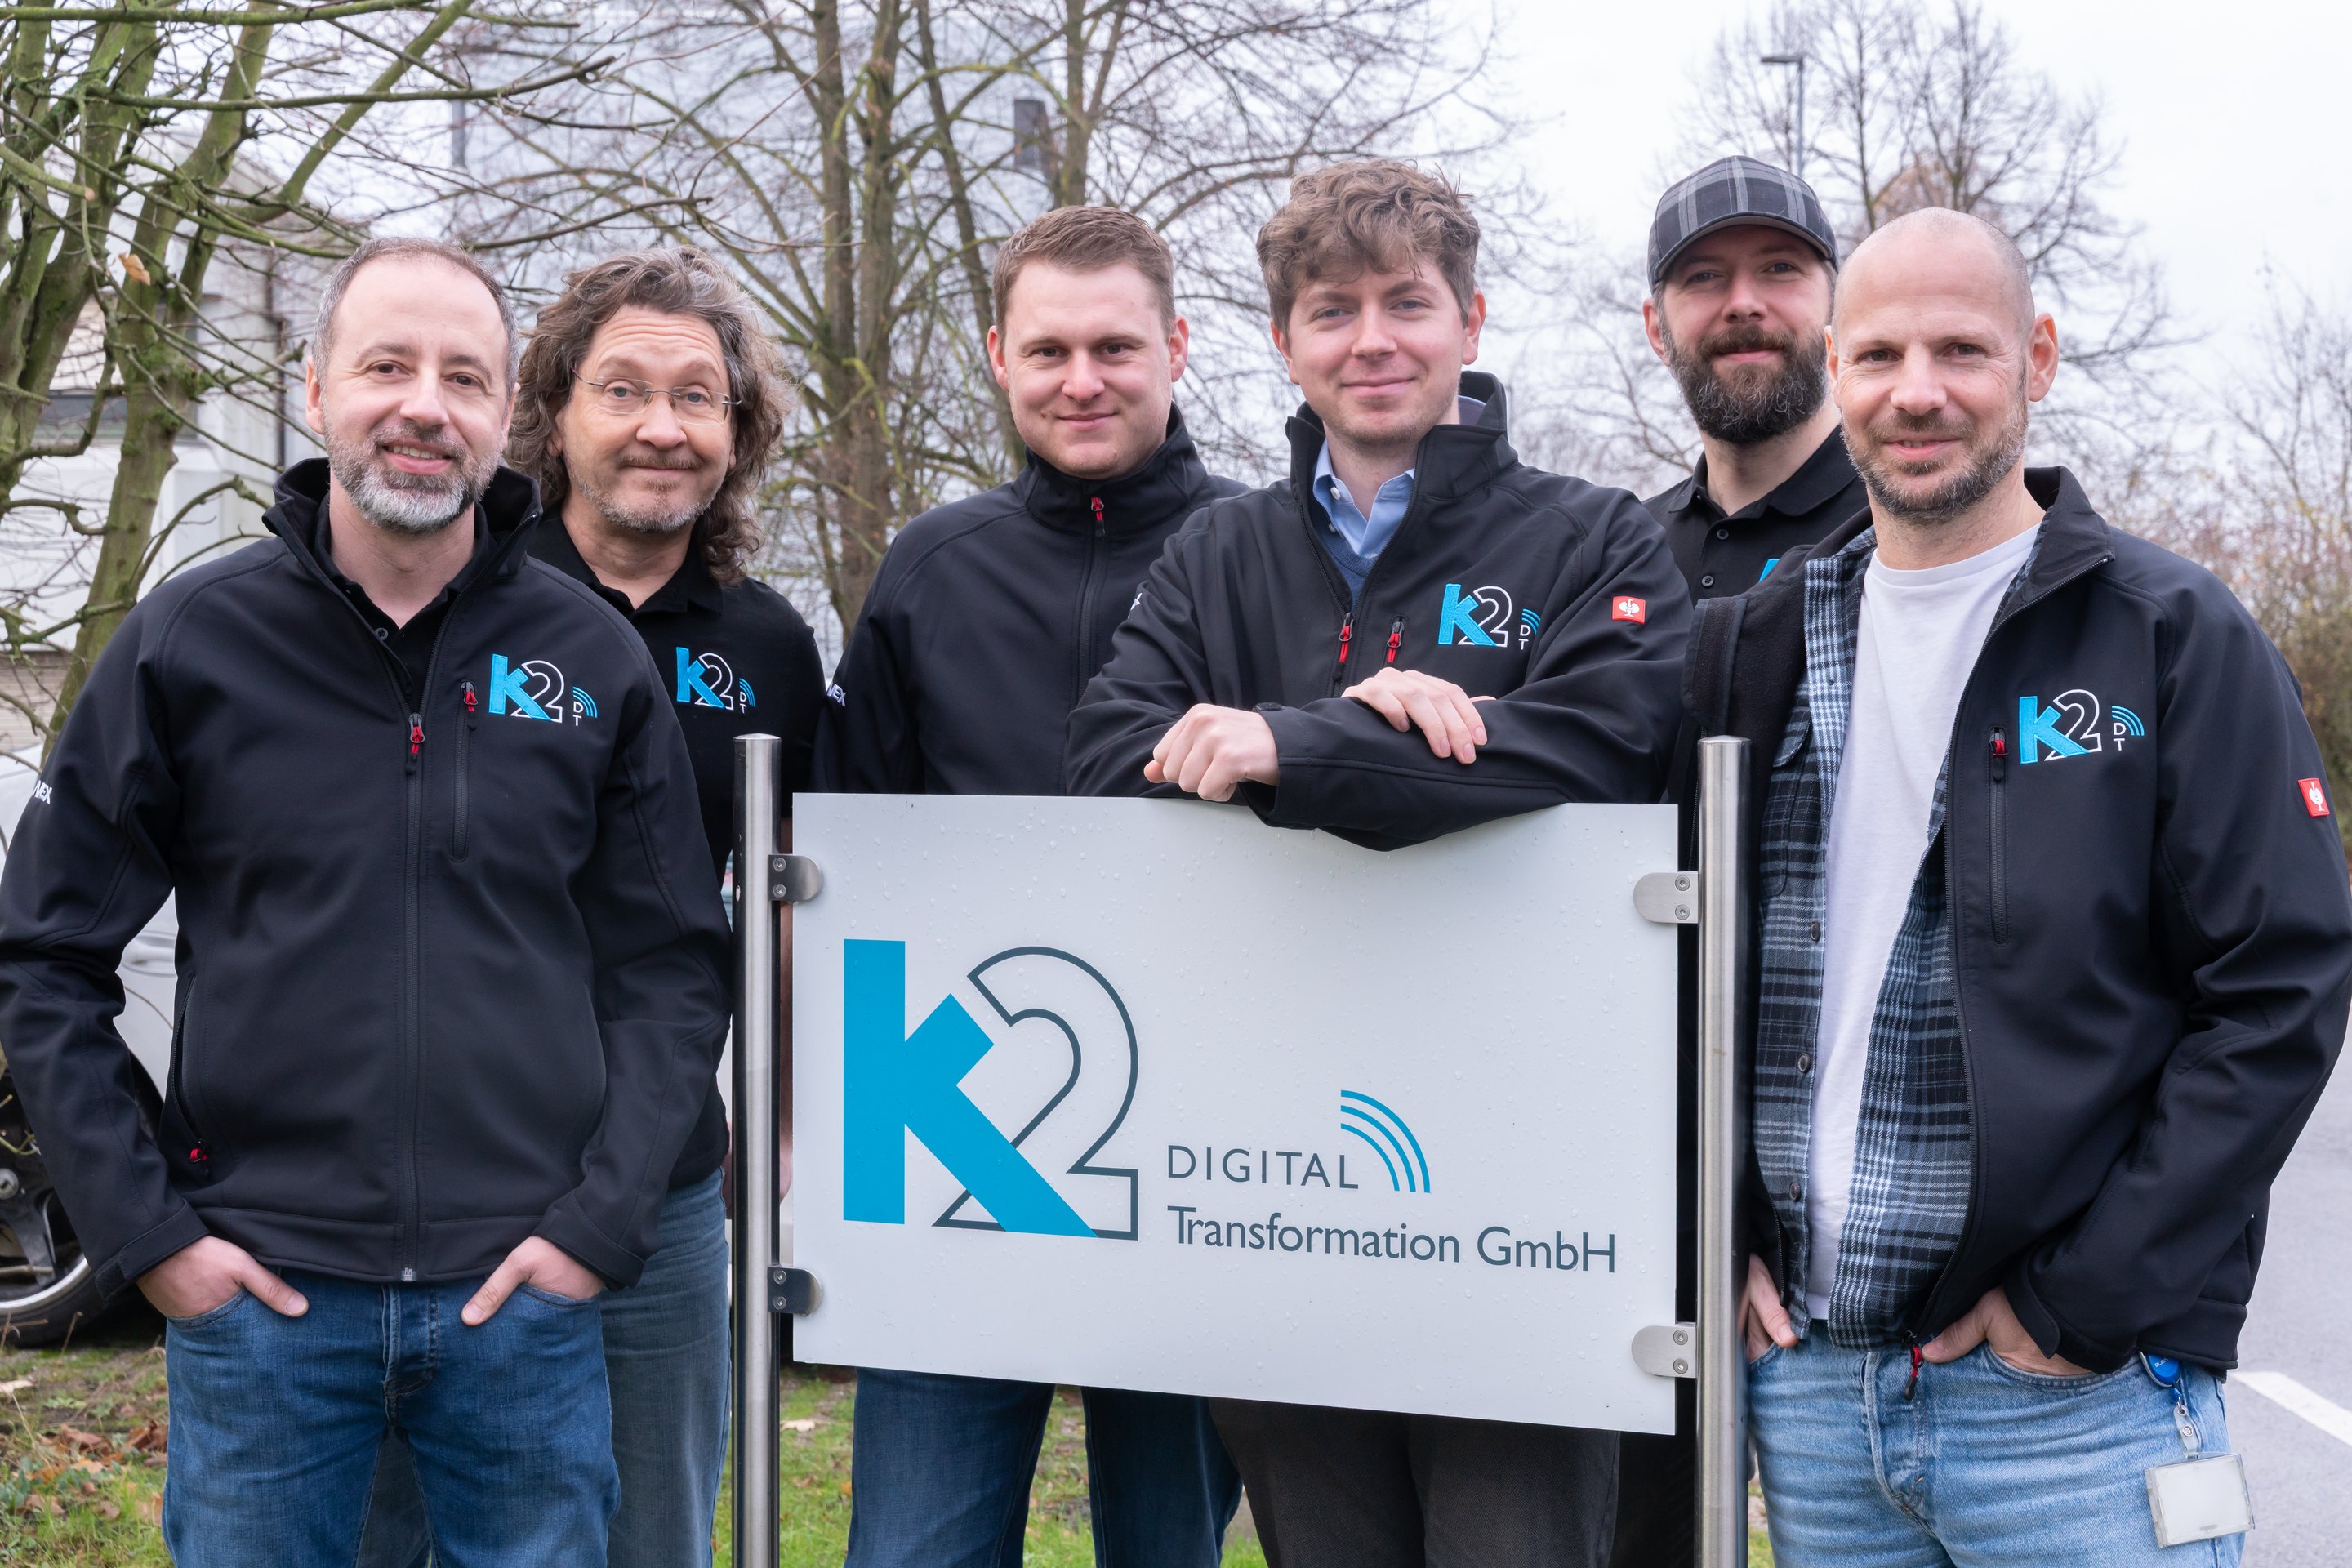
Our office and test lab are located in Gelsenkirchen, where we develop, test and optimize machine-vision solutions and Ignition systems.
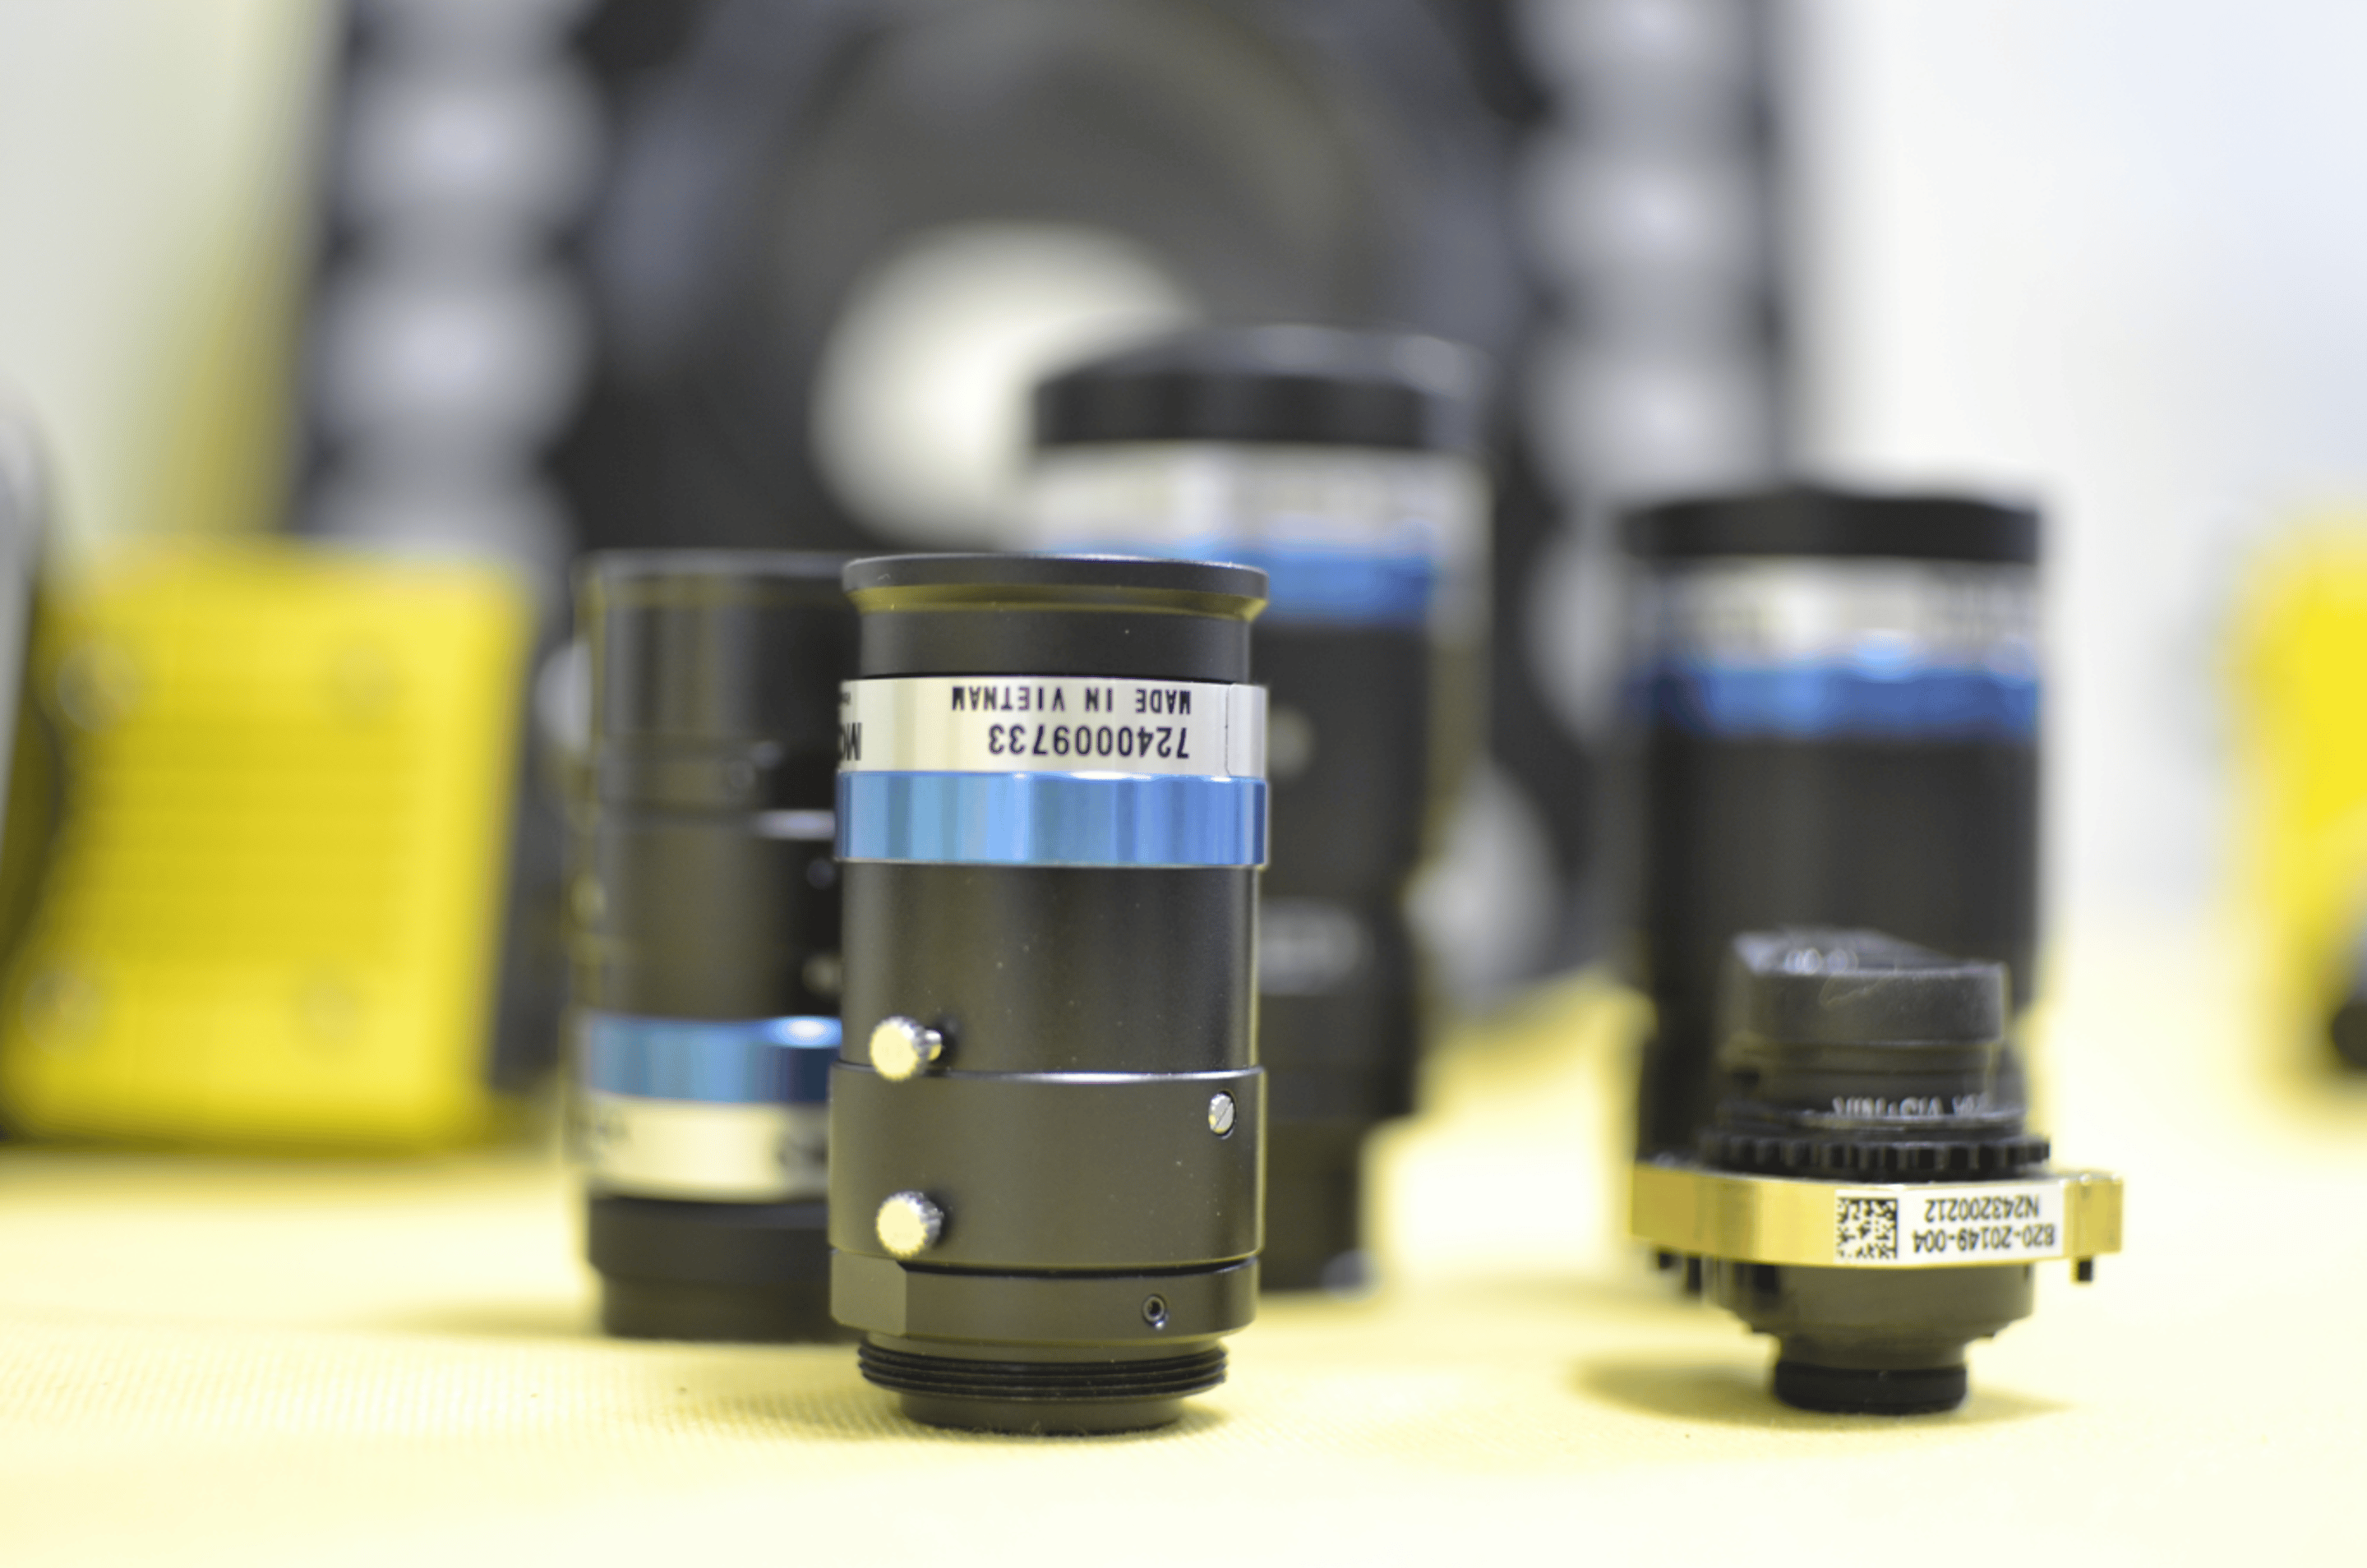
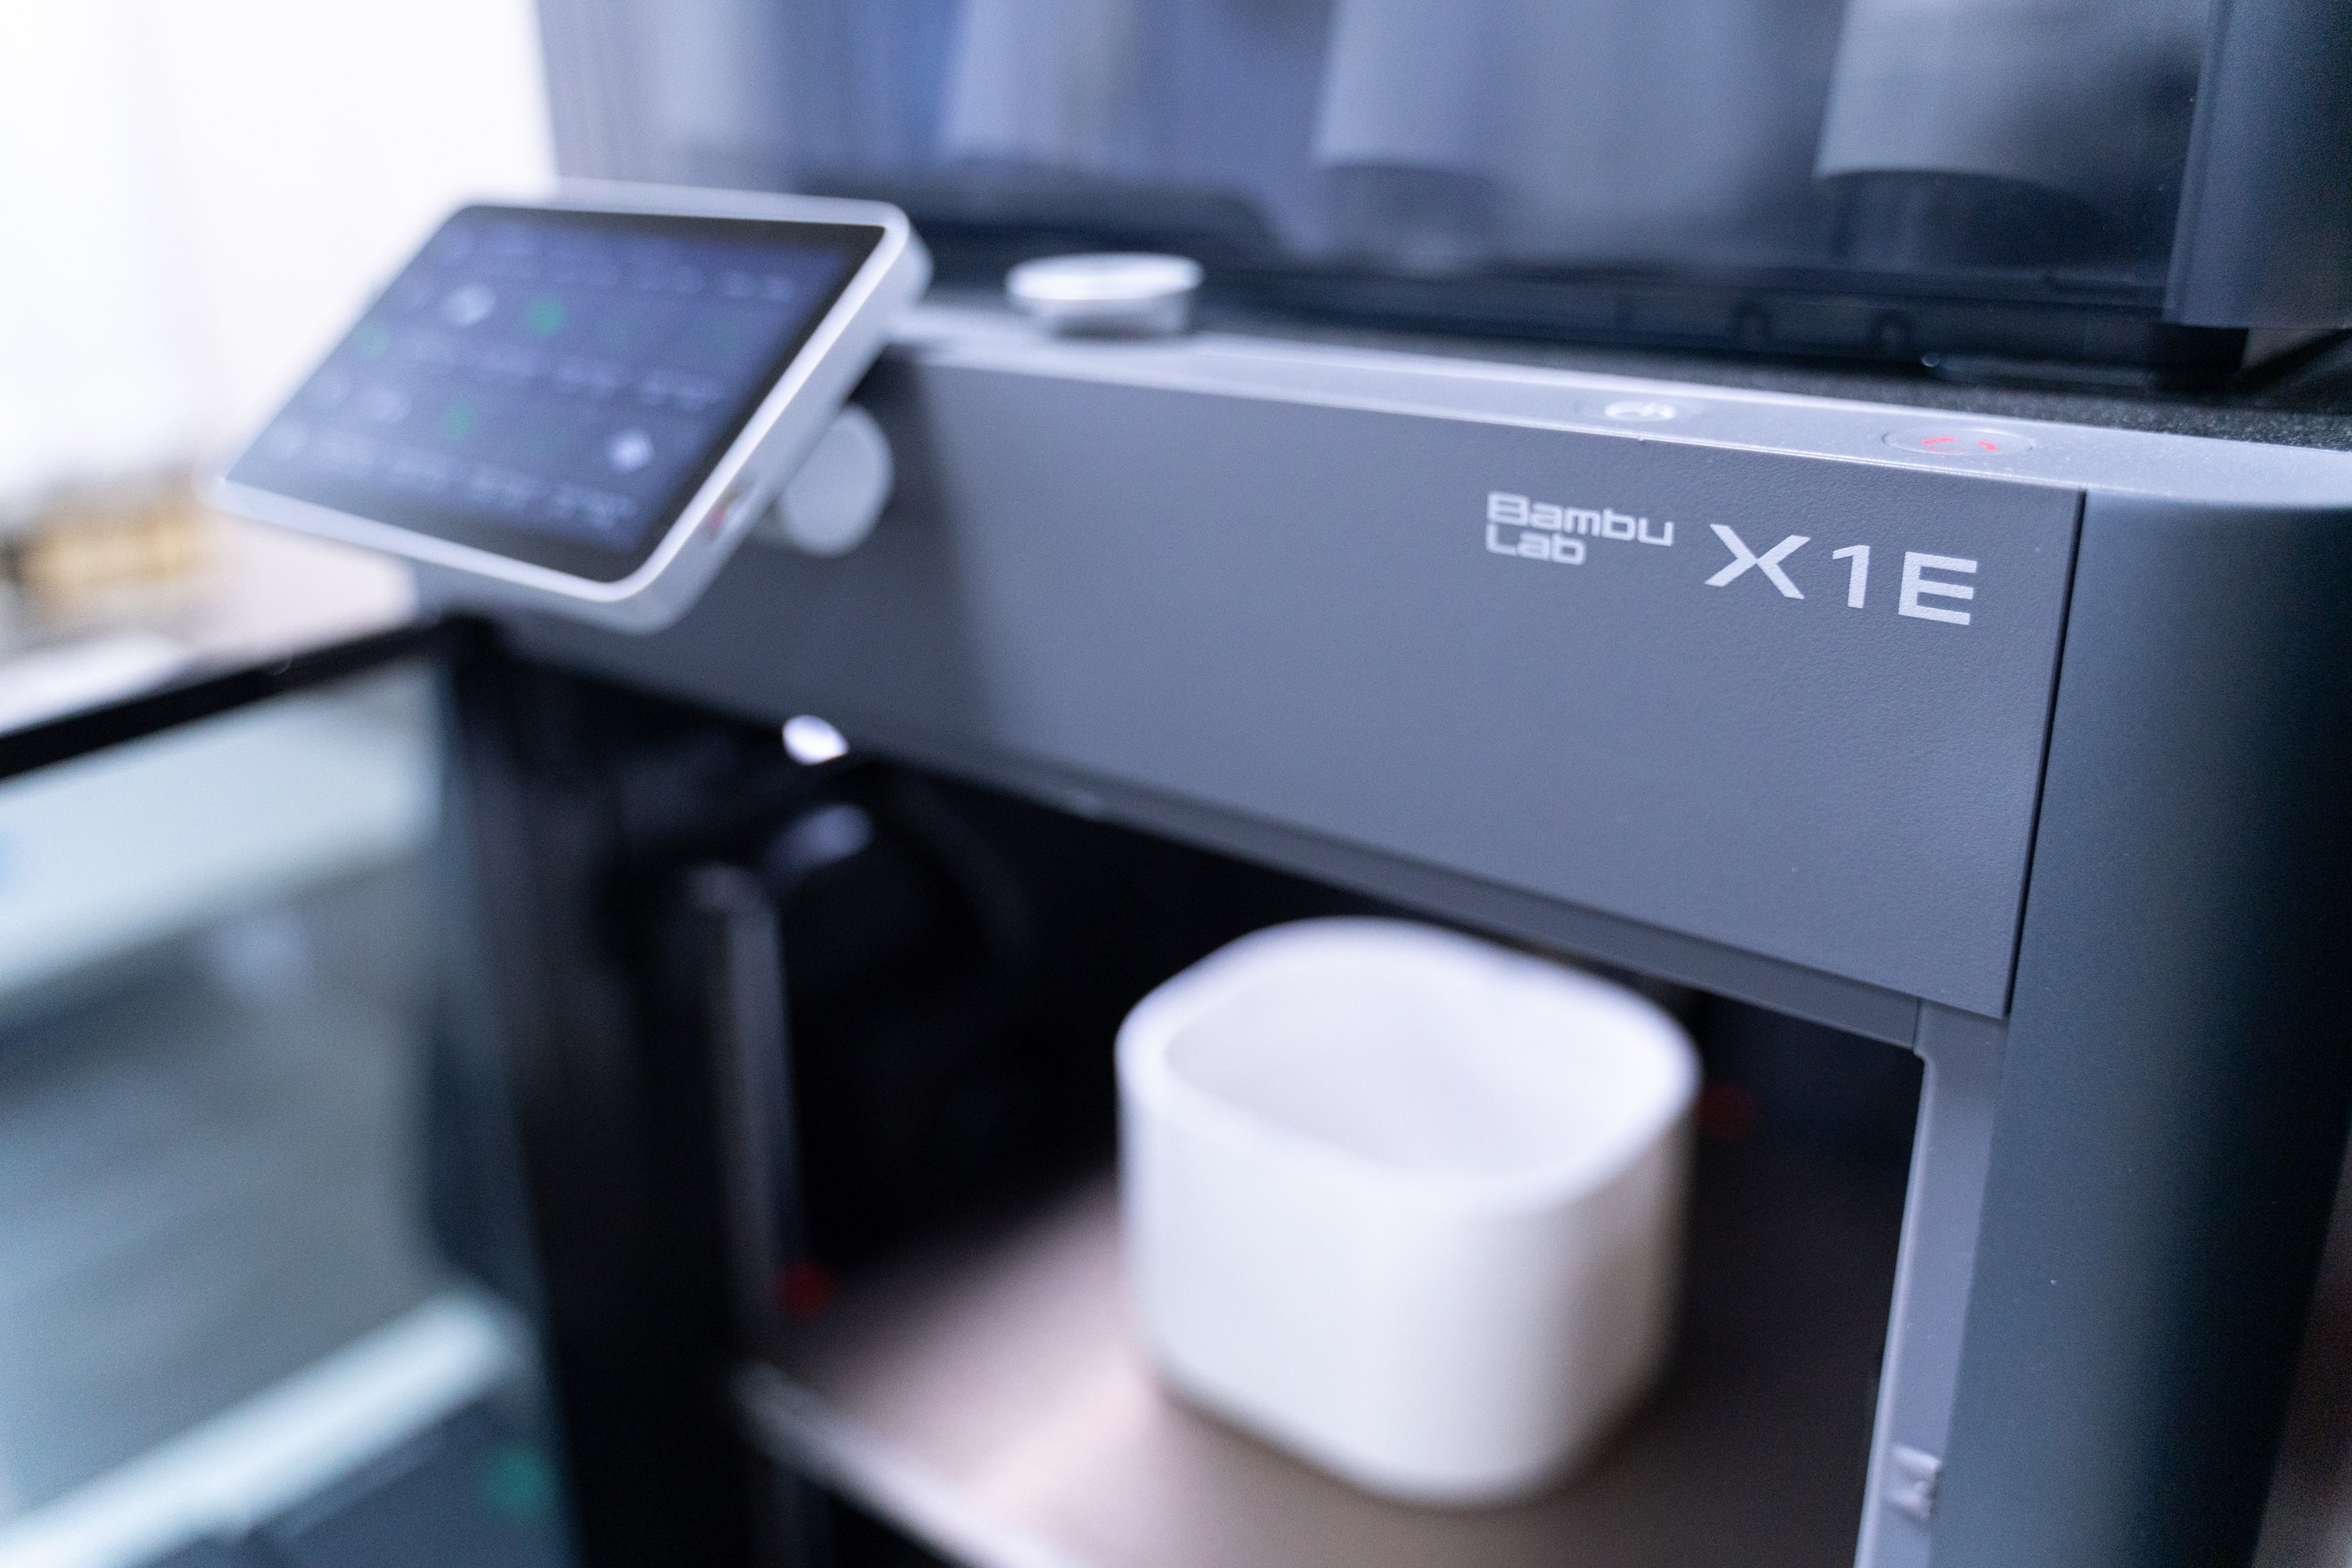
The lab includes Cognex systems, a co-bot, 3D printers and conveyor setups so applications can be tested directly with your parts. Customers are welcome to experience live demos and test solutions together with us.
Loading the map establishes a connection to OpenStreetMap. Your IP address may be transmitted to OpenStreetMap.
Open in OpenStreetMap
Your contact Jannis Meining
Talk to Jannis Meining about where your team loses time today and which Ignition use case could help first. The initial consultation is free and without obligation.